
Numbers have played an important role in my professional career in market research. The vast majority of the reports and presentations of research findings were filled with charts and tables containing lots of statistics. As a result, I have often yearned for a chart that would summarize our experiences since Kate’s diagnosis eight years ago.
That would have been possible if I had kept statistical records along the way. During the early years after the diagnosis, I didn’t even think of doing that. As time progressed, I felt I didn’t have time to keep an accurate statistical record. I settled for what we researchers call a qualitative approach. I simply describe in words what our lives have been like. Most people can relate to that more easily anyway.
The problem is that words don’t always convey the changes that occur over time. For example, I find that my early posts talked about how short her memory was. Some of my recent entries say essentially the same thing, and yet I know that her short-term memory is vastly shorter now that it was then. I do try to call attention to symptoms the first time they appear. I also try to give some approximate time indicators. For example, I often say that Kate’s sleeping pattern started changing during the spring of last year or the approximate number of months since the pattern started changing. For the most part, however, this blog consists almost entirely of my descriptions of our experiences.
Having said this, I have discovered that launching the journal as a blog one year ago has provided statistical data. Only one of those gives me much information that relates to our experience with Alzheimer’s, and it is very limited. The WordPress software I use organizes all of the posts by year. I put that together in the chart below. It doesn’t begin to do justice to what has gone on the past eight years; however, it does show how the progression of Kate’s Alzheimer’s has affected my writing.
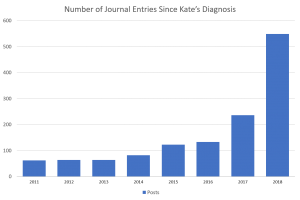
During the first three years (2011, 2012, and 2013), our lives didn’t change much. I didn’t have as many things to write about. That began changing in the years 2014, 2015, and 2016. I remember that 2014 was the year I felt I should tell our children and close friends about Kate’s diagnosis. Early that same year, we went to New Zealand. I knew then that our traveling travelling days were numbered. It was becoming increasingly difficult to manage everything on long trips. We took our last overseas trip (Switzerland) in 2015. In 2016, I saw more signs of change. I believed that our annual trip to Chautauqua would be our last. Fortunately, we were able to make one more trip in 2017. That year I wrote 77% more posts than the preceding year. The big jump occurred last year. Our lives changed substantially as did the number of my posts. They were up 132% last year. Of course, that was the first year of my blog. I know I was more diligent in writing. Even with that, however, I have always tried to write when I had something I wanted to say (not necessarily what readers might want to hear <g>). In 2018, that happened more often.
So, what is in store for 2019? The answer is I don’t know. As in previous years that will depend on what happens next. If I were to guess, I would say that the posts will level out for a while and, possibly, decline. Through the first 36 days of the current year I am averaging one and a third posts a day. I expect that Kate will sleep more, and we will be less active this year than last. That might mean fewer things for me to report. As with so many things, time will tell.


